ARTICLES · 24 Jul 2026
Building Production AI Observability on Kubernetes: OpenTelemetry, Langfuse, Prometheus & Grafana From Zero to Scale
A technical examination of Kubernetes AI observability using OpenTelemetry, Langfuse, Prometheus, Grafana, and operational telemetry.
Originally published at hashnode.
Building Production-Grade AI Observability on Kubernetes
Most AI teams are solving the wrong problem.
Everyone is benchmarking models.
Very few teams are benchmarking infrastructure.
Production failures rarely happen because GPT-5, Claude or Gemini suddenly become “less intelligent.”
They happen because nobody knows:
why latency suddenly doubled
which prompt caused hallucinations
which deployment increased token usage
why costs exploded overnight
which customer experienced degraded responses
where requests failed across twenty microservices
Traditional monitoring tools were never designed for AI workloads.
CPU usage doesn’t explain prompt quality.
Memory usage doesn’t explain hallucinations.
Pod health doesn’t explain token spikes.
HTTP 200 doesn’t mean the response was useful.
AI introduces an entirely new operational layer that demands observability beyond infrastructure.
This article walks through the architecture used to monitor production AI systems at scale.
The Hidden Problem
A normal SaaS request looks like this. Building Production-Grade AI Observability on Kubernetes
Most AI teams are solving the wrong problem.
Everyone is benchmarking models.
Very few teams are benchmarking infrastructure.
Production failures rarely happen because GPT-5, Claude or Gemini suddenly become “less intelligent.”
They happen because nobody knows:
why latency suddenly doubled which prompt caused hallucinations which deployment increased token usage why costs exploded overnight which customer experienced degraded responses where requests failed across twenty microservices
Traditional monitoring tools were never designed for AI workloads.
CPU usage doesn’t explain prompt quality.
Memory usage doesn’t explain hallucinations.
Pod health doesn’t explain token spikes.
HTTP 200 doesn’t mean the response was useful.
AI introduces an entirely new operational layer that demands observability beyond infrastructure.
This article walks through the architecture used to monitor production AI systems at scale.
The Hidden Problem
A normal SaaS request looks like this. User
↓
API
↓
Database
↓
Response
Simple.
Observable.
Predictable.
AI applications are nothing like this.
A single prompt may involve:
Retrieval Embeddings Vector Search Reranking Multiple LLMs Tool Calling Function Execution Guardrails Caching Memory Response Validation
One user request can generate dozens of internal operations.
Without tracing, you’re blind.
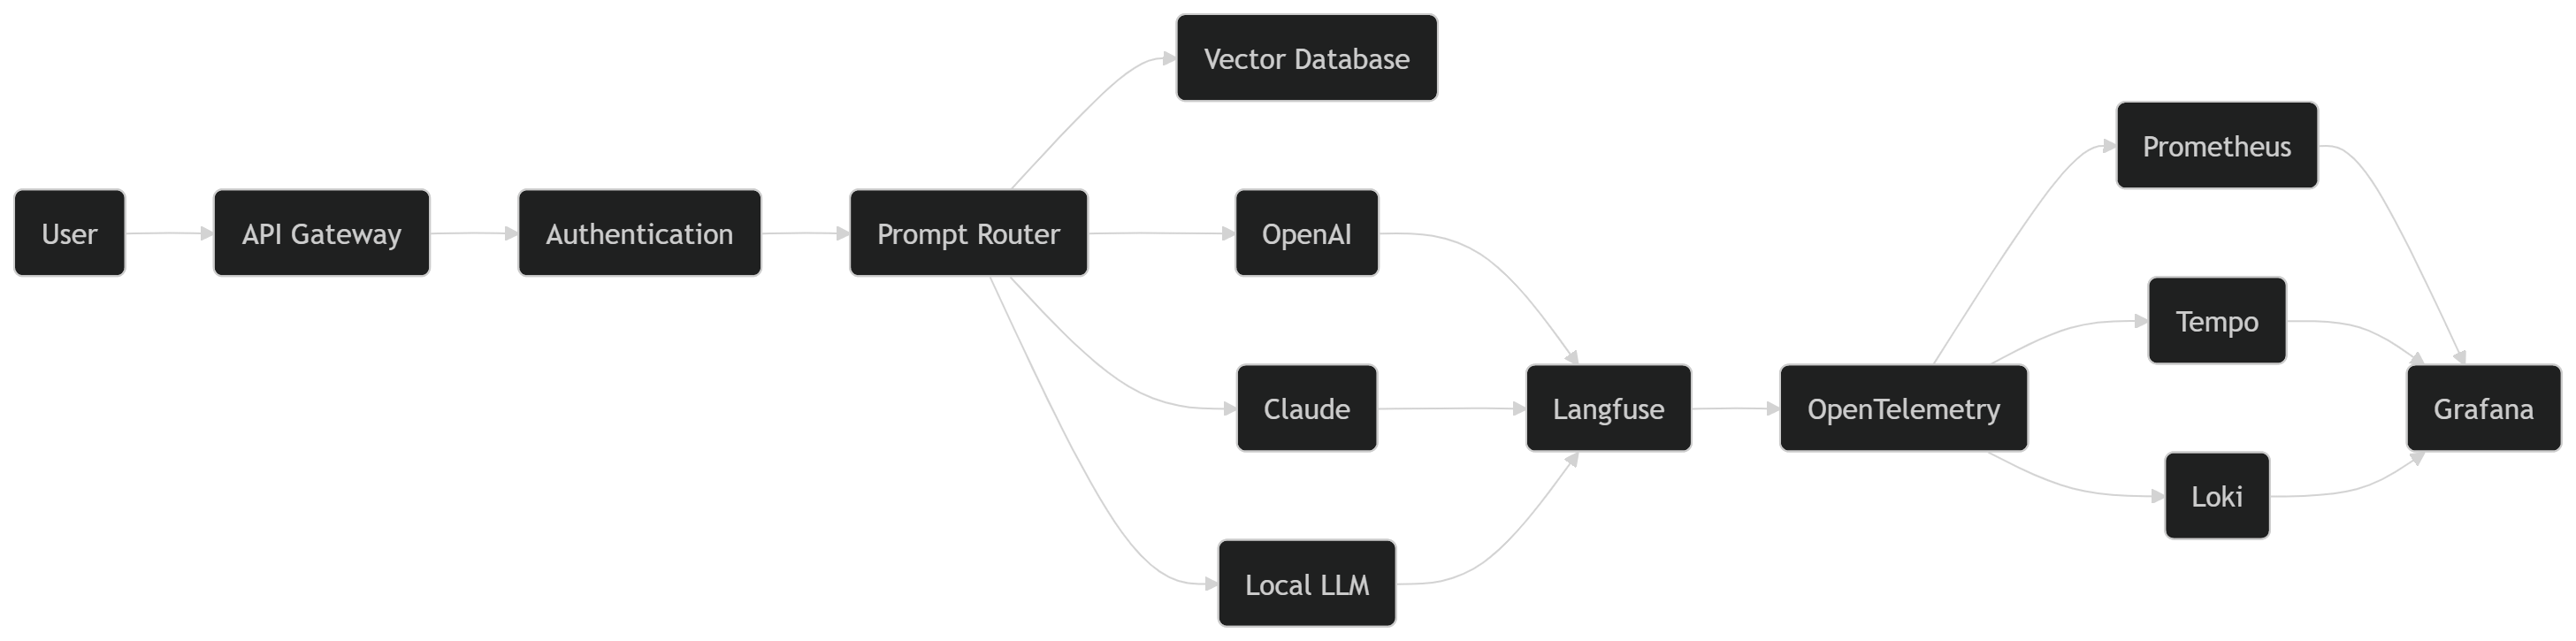
Production Architecture
This is no longer an API.
It’s an observable AI platform.
Request Journey
Every prompt creates telemetry.
User Prompt

↓

Gateway

↓

Authentication

↓

Prompt Version

↓

RAG Search

↓

LLM

↓

Tool Calls

↓

Response Validation

↓

User

↓

Telemetry Export
Every stage emits:
traces
metrics
logs
prompt metadata
token usage
latency
costs
Nothing is invisible.
The Four Signals
Every production AI platform should collect four signals.
Metrics
Metrics answer
“How healthy is the system?”
Examples
Requests/sec
Tokens/sec
GPU Utilization
Prompt Errors
Cache Hit Rate
Cost Per Minute
Logs
Logs answer
“What happened?”
Examples
Prompt failed
Context too large
Vector timeout
API quota exceeded
Authentication failed
Traces
Traces answer
“Where did it happen?”
Example
User

↓

Gateway

↓

Retriever

↓

Embedding

↓

LLM

↓

Guardrail

↓

Response
Latency becomes visible.
AI Metadata
Traditional observability stops here.
Modern AI observability continues.
Capture
Prompt Version
Temperature
Top P
Model
Provider
Token Usage
Cost
Latency
Tool Calls
User Feedback
Evaluation Score
Hallucination Flag
This is where Langfuse becomes invaluable.
Why Langfuse?
Prometheus knows infrastructure.
Grafana knows dashboards.
OpenTelemetry knows telemetry.
Langfuse understands AI.
It stores:
Prompt history
Prompt versions
Token accounting
Prompt evaluations
Datasets
Experiments
LLM costs
User feedback
Model comparisons
Without it you’re monitoring servers instead of AI.
Failure Path
Production systems don’t fail gracefully.
They fail silently.
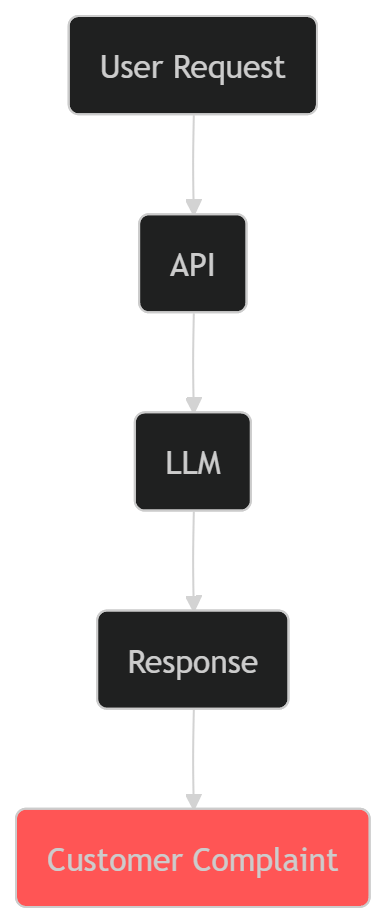
Nobody knows why.
Now compare with observability.
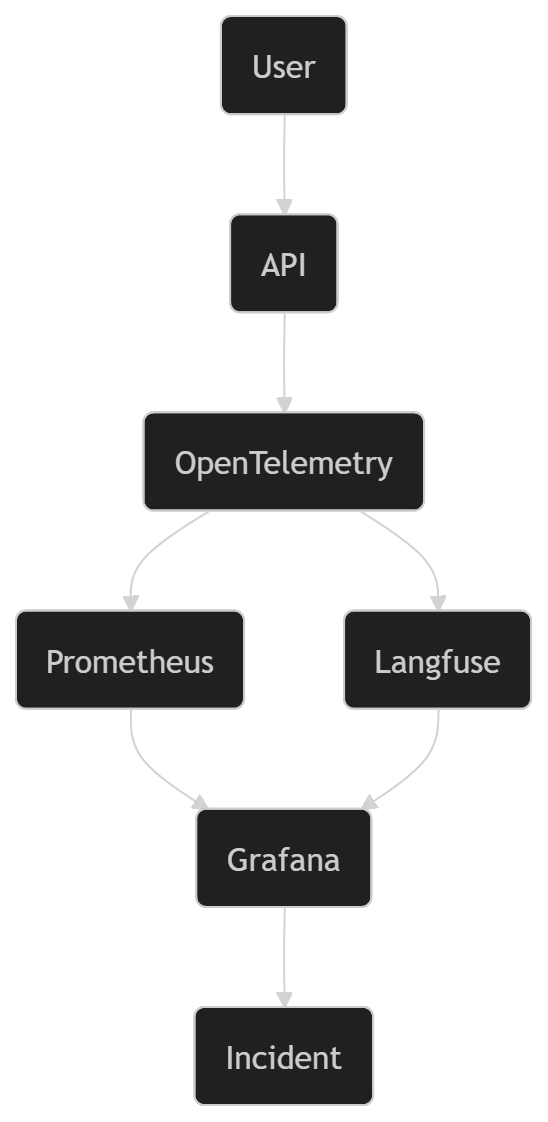
Failures become explainable instead of mysterious.
Production Philosophy
Infrastructure isn’t just about uptime.
It’s about visibility.
Every production AI system should answer these questions instantly:
Which prompt version failed?
Which model generated it?
How many tokens were consumed?
Which deployment introduced the regression?
Which customer experienced it?
How much money did it cost?
Which trace contains the failure?
If you can’t answer those questions in under five minutes, you don’t have observability.
You have dashboards.
Building the Kubernetes AI Platform
At this point, telemetry exists.
The next challenge is making it reliable.
Most teams deploy an LLM behind an API and call it a day.
Production platforms require much more.
They need to survive:
Node failures
Rolling deployments
Traffic spikes
Model outages
Network latency
Token quota exhaustion
Regional failures
Kubernetes provides the control plane.
The platform still needs to be designed.
Production Kubernetes Architecture
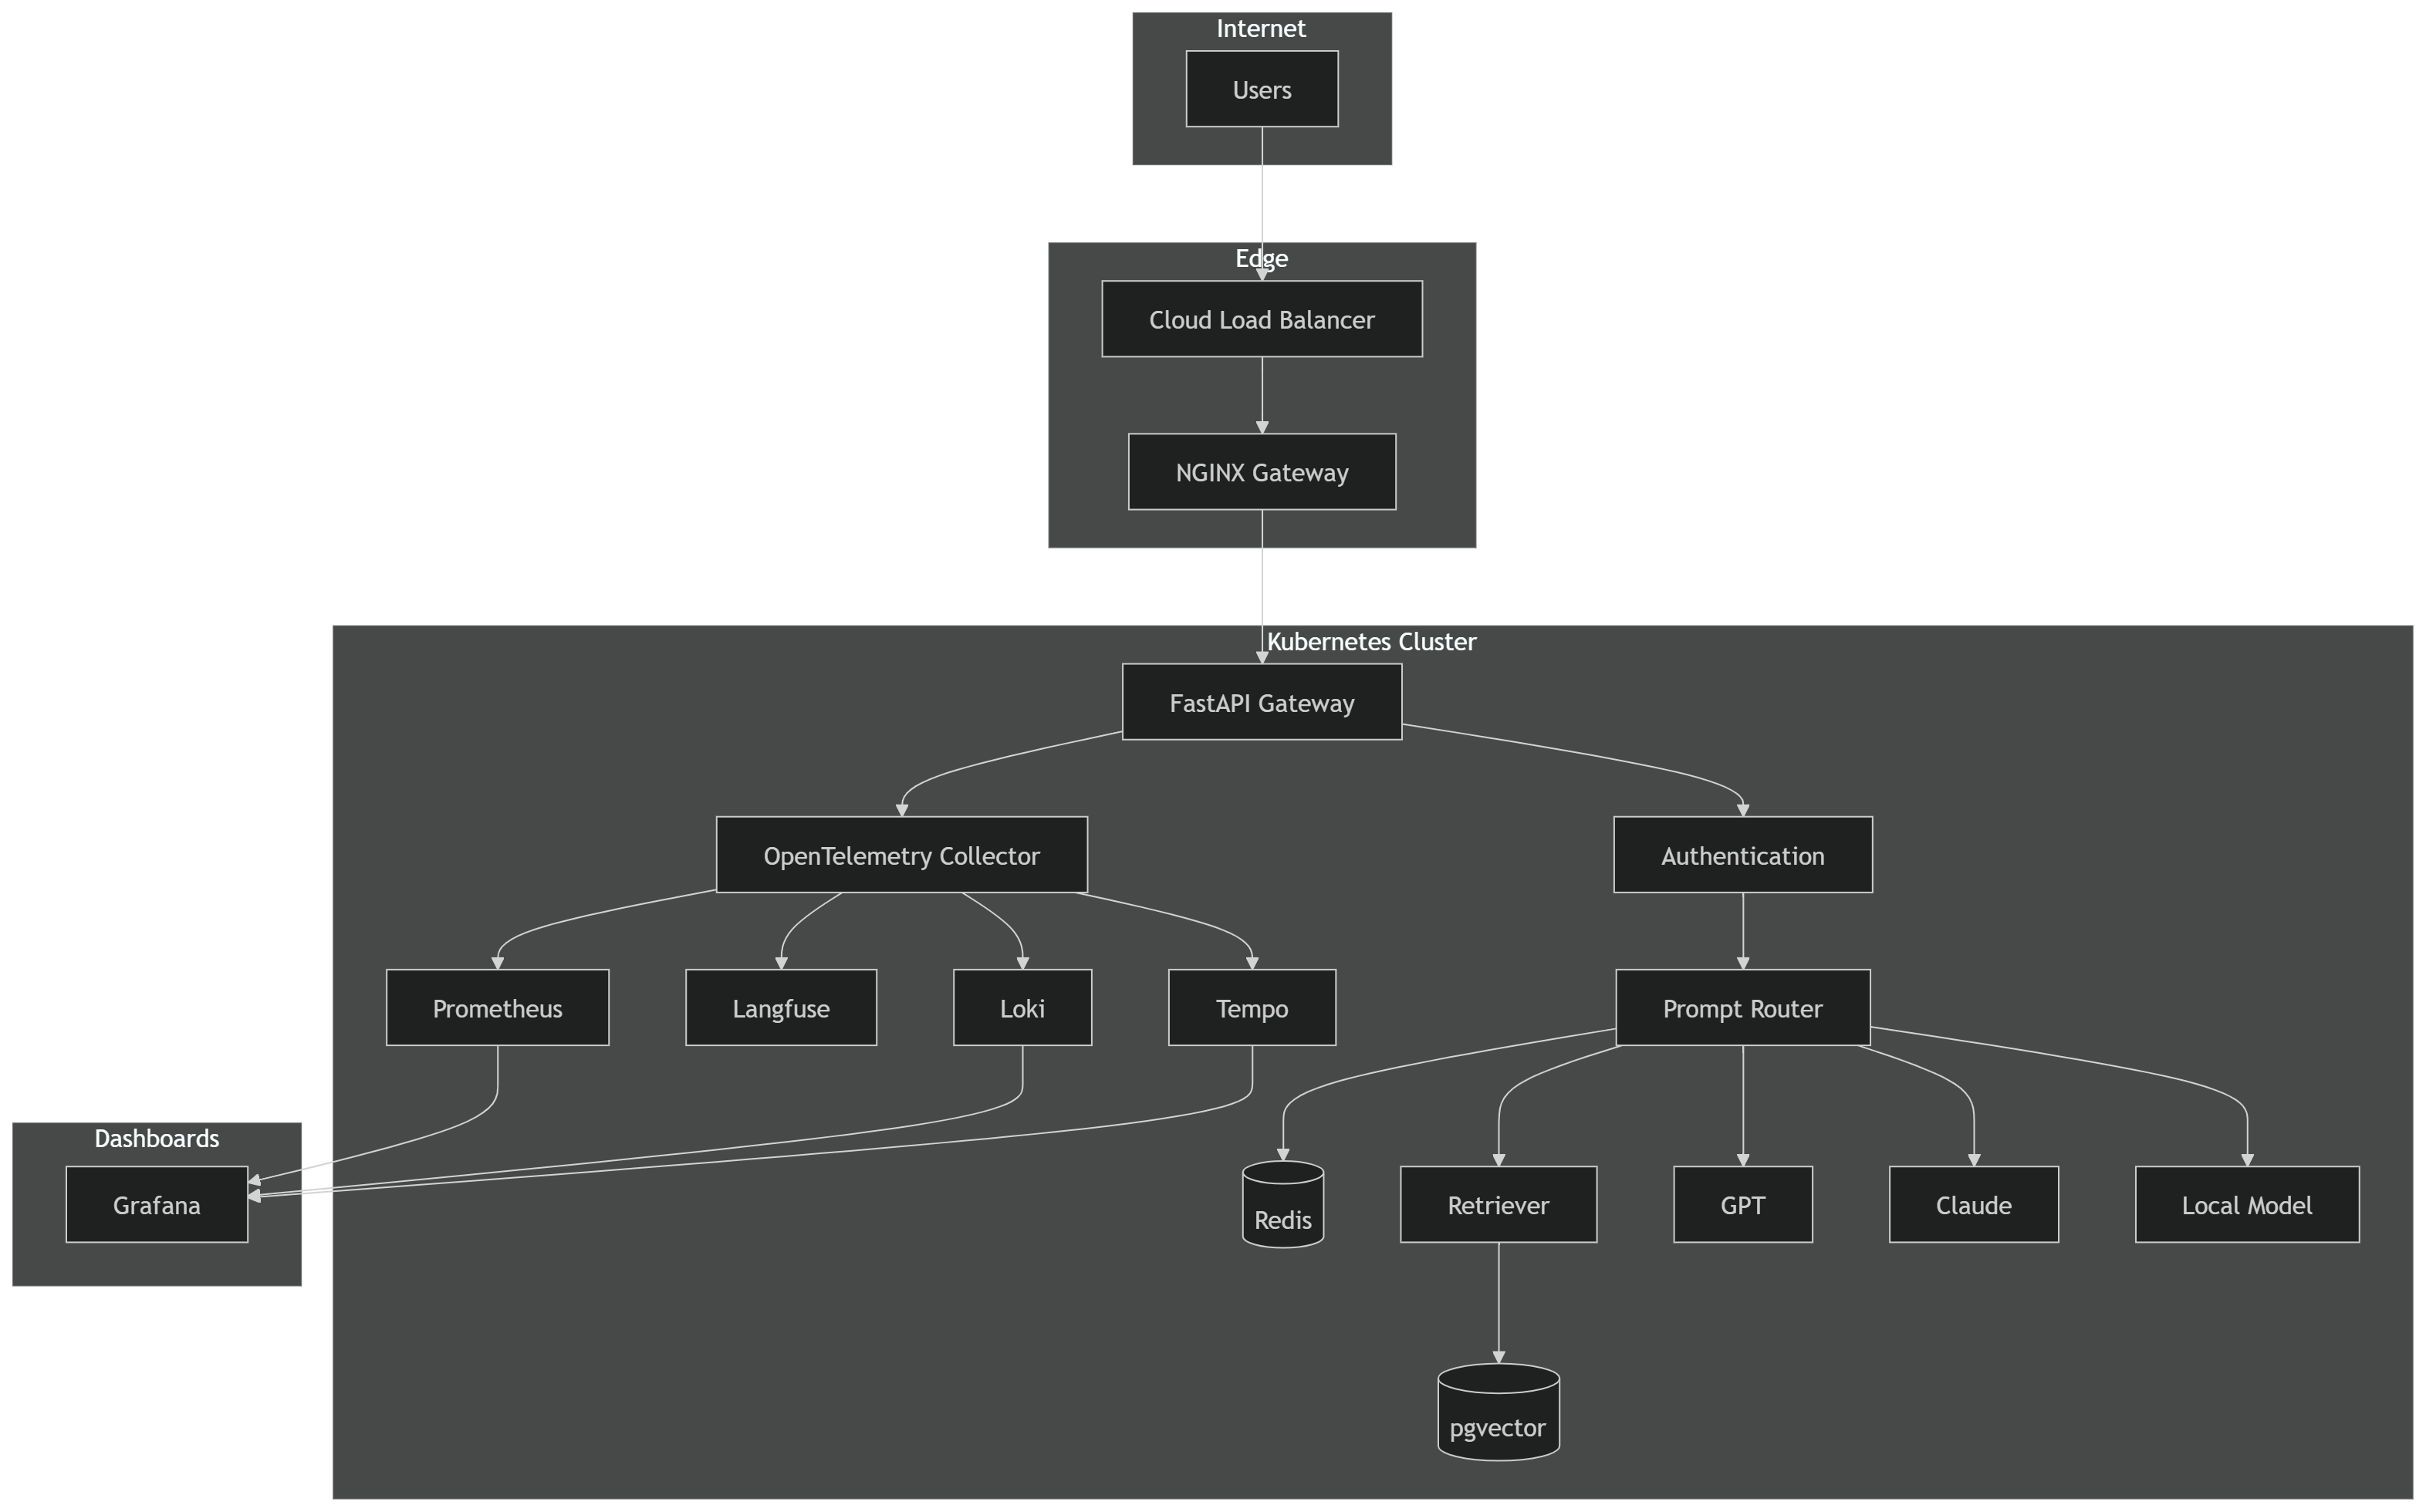
Request Flow
A production request looks more like this.
Client Request

↓

Load Balancer

↓

Ingress

↓

API Gateway

↓

Authentication

↓

Prompt Validation

↓

Cache Lookup

↓

RAG Retrieval

↓

LLM Selection

↓

Generation

↓

Response Validation

↓

Telemetry Export

↓

Client
Notice something.
Generating the response is only one step.
Everything else exists to make production reliable.
Why OpenTelemetry?
Infrastructure teams already collect metrics.
AI platforms need context.
Every request should carry information such as
User ID
Prompt Version
Deployment Version
Model
Trace ID
Region
Environment
Request Latency
Token Count
Without context, metrics become isolated numbers
OpenTelemetry Architecture
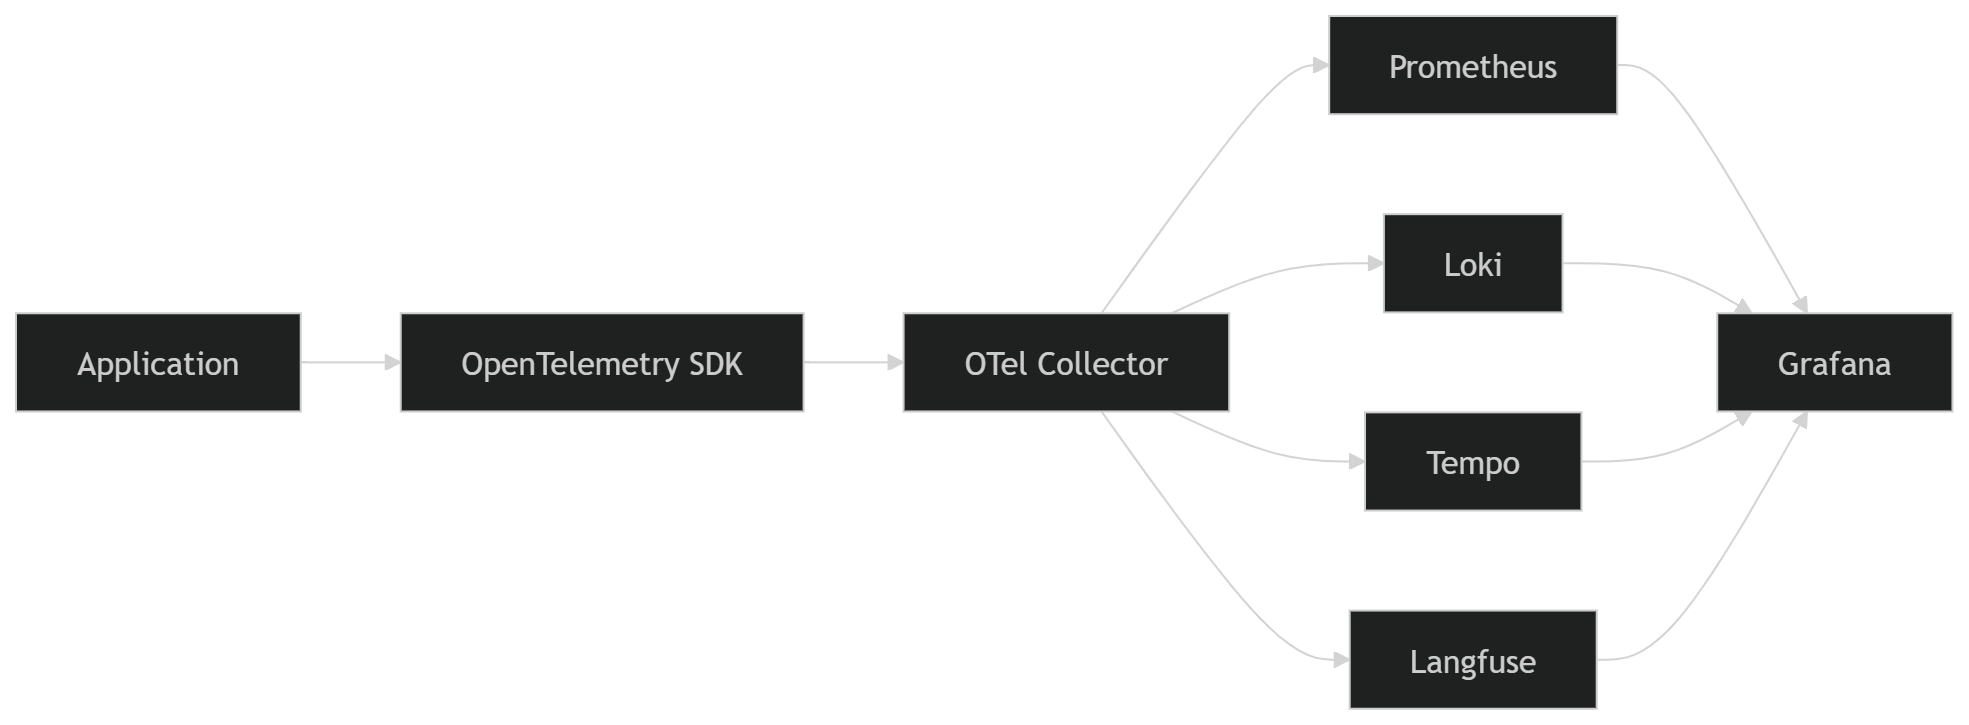
The collector becomes the central telemetry pipeline.
Applications export once.
The collector distributes everywhere.
AI Request Lifecycle
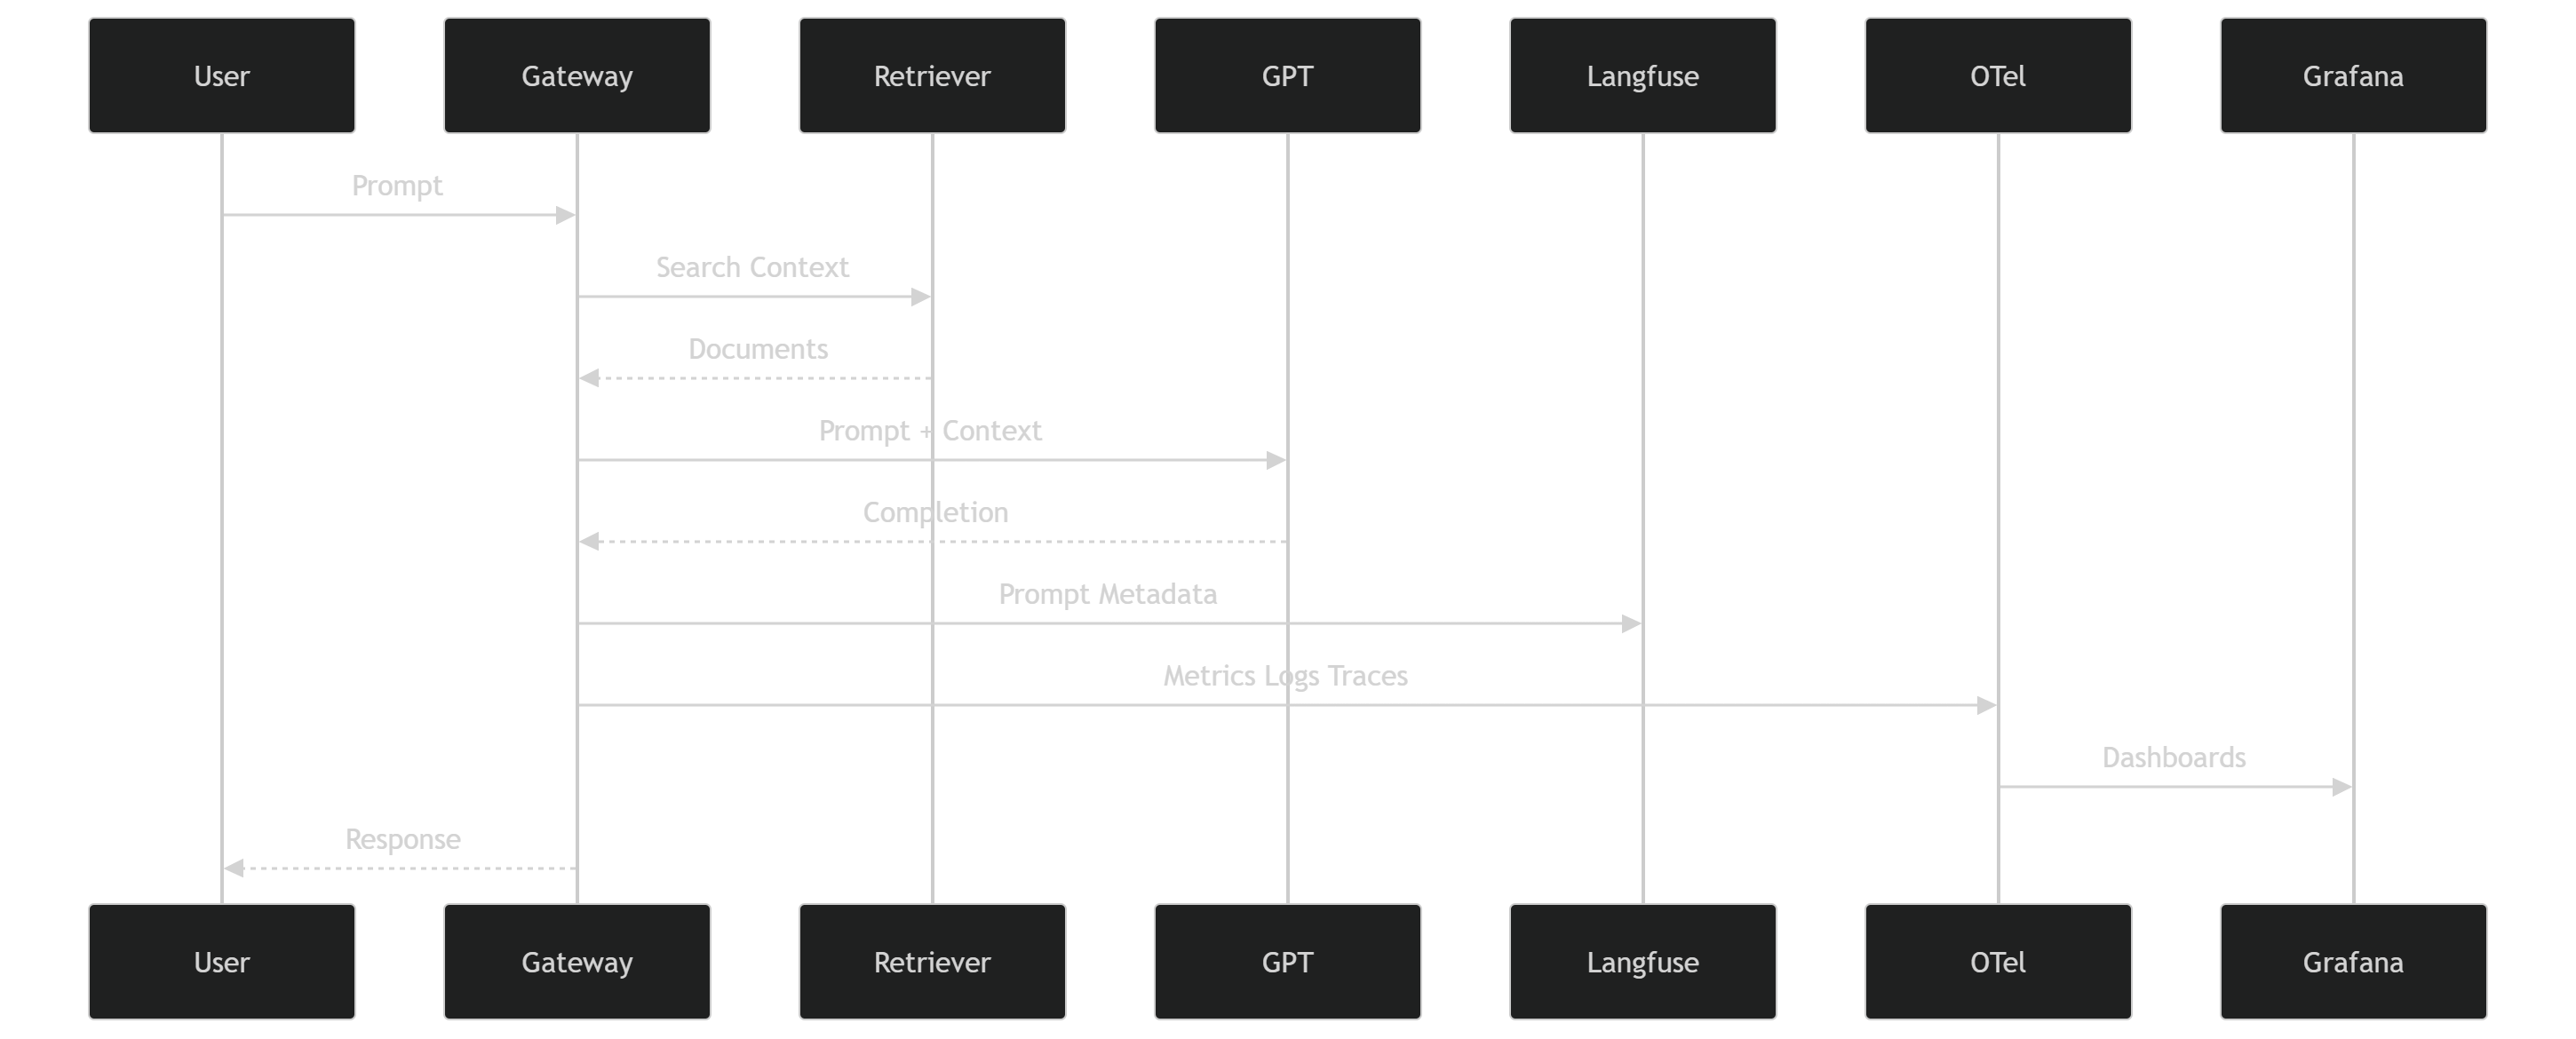
What Gets Collected?
Every request should generate telemetry.
| Category | Examples |
|---|---|
| Infrastructure | CPU, Memory, Network |
| Kubernetes | Pod Restarts, Replica Count |
| API | Request Rate, Error Rate |
| AI | Prompt Version, Model |
| Cost | Input Tokens, Output Tokens |
| Performance | Latency, Throughput |
| Reliability | Retries, Timeouts |
| User Experience | Feedback Score |
The AI layer is just as important as the infrastructure layer.
Production Deployment Flow

Every deployment should be repeatable.
Nobody should SSH into production.
Nobody should edit Kubernetes resources manually.
Everything begins with Git.
Failure Is Expected
Healthy platforms assume components will fail.
Examples include:
OpenAI rate limits requests
Anthropic API becomes unavailable
Vector database is slow
Redis becomes unavailable
One Kubernetes node crashes
Prometheus restarts
Grafana becomes unavailable
A production platform should continue operating with degraded functionality instead of complete failure.
Production Readiness Checklist
Before calling an AI system production-ready, verify that it has:
Kubernetes health probes
Horizontal Pod Autoscaler
OpenTelemetry instrumentation
Prompt version tracking
Distributed tracing
Cost monitoring
Centralized logging
Secret management
GitOps deployment
Automatic rollback
Alerting
Audit logs
Disaster recovery plan
An AI application becomes a production platform when it can answer operational questions as reliably as it answers user prompts.
Infrastructure as Code and GitOps
Production platforms should be reproducible.
If rebuilding your environment depends on tribal knowledge, SSH sessions, or a checklist in someone’s notebook, it isn’t production-ready.
Infrastructure should be recreated from Git.
Nothing else.
Production Infrastructure
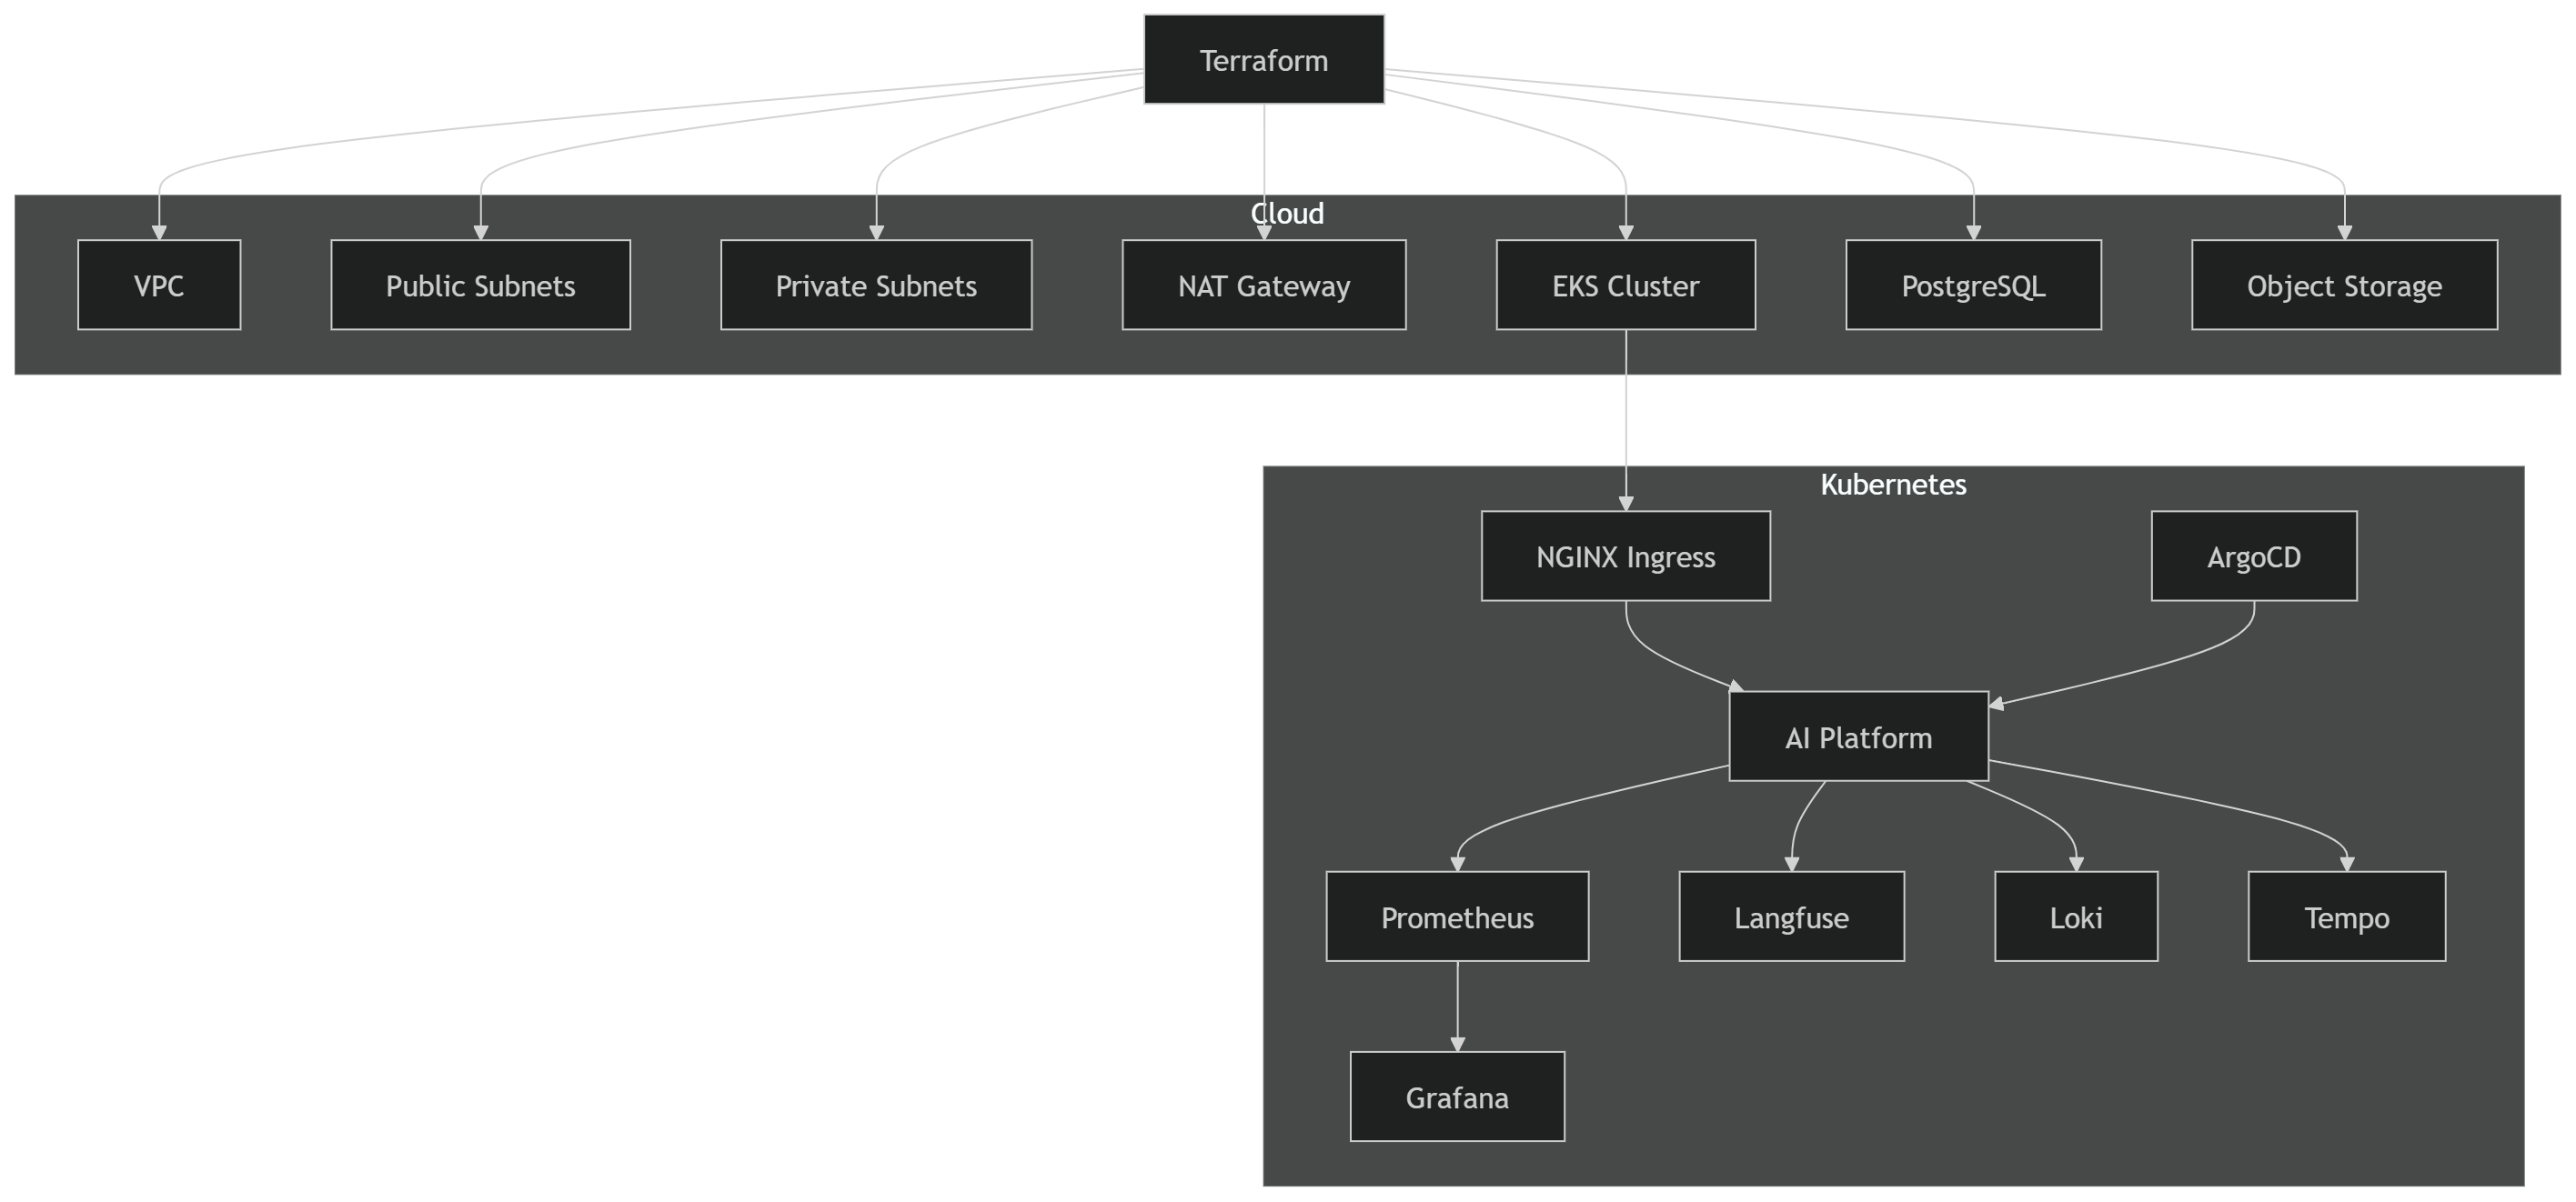
Terraform provisions the infrastructure.
GitOps manages the applications.
Those responsibilities should remain separate.
Why Infrastructure as Code Matters
Creating infrastructure manually introduces inconsistency.
Examples include:
Different security groups
Incorrect IAM permissions
Missing encryption
Network drift
Resources with no ownership
Production changes that cannot be audited
Infrastructure as Code eliminates these problems by making every change reviewable before it reaches production.
Repository Structure
A production repository should separate infrastructure from applications.
production-ai-platform/

├── terraform/
│   ├── modules/
│   ├── environments/
│   │   ├── dev/
│   │   ├── staging/
│   │   └── production/
│   └── backend.tf
│
├── kubernetes/
│   ├── base/
│   ├── overlays/
│   └── manifests/
│
├── helm/
│
├── argocd/
│
├── monitoring/
│   ├── prometheus/
│   ├── grafana/
│   ├── loki/
│   └── tempo/
│
├── langfuse/
│
├── .github/workflows/
│
├── docs/
│
└── README.md
Each directory has a single responsibility.
GitOps Workflow
Git becomes the deployment interface.
Nobody deploys from a laptop.

Every deployment follows the same path.
Continuous Delivery Pipeline
A production pipeline does more than build containers.
Code Commit

↓

Unit Tests

↓

Security Scan

↓

Container Build

↓

Image Signing

↓

Push to Registry

↓

Manifest Update

↓

Git Commit

↓

ArgoCD Sync

↓

Deployment

↓

Health Check

↓

Telemetry Validation

↓

Production
The deployment is complete only after the platform confirms it is healthy.
Secret Management
Production secrets should never exist in:
Git repositories
Kubernetes manifests
Dockerfiles
CI variables in plain text
Instead, use a dedicated secret manager and inject secrets at runtime.
Examples include:
AWS Secrets Manager
Azure Key Vault
HashiCorp Vault
Applications request credentials only when they need them.
Progressive Delivery
A deployment should prove itself before serving everyone.
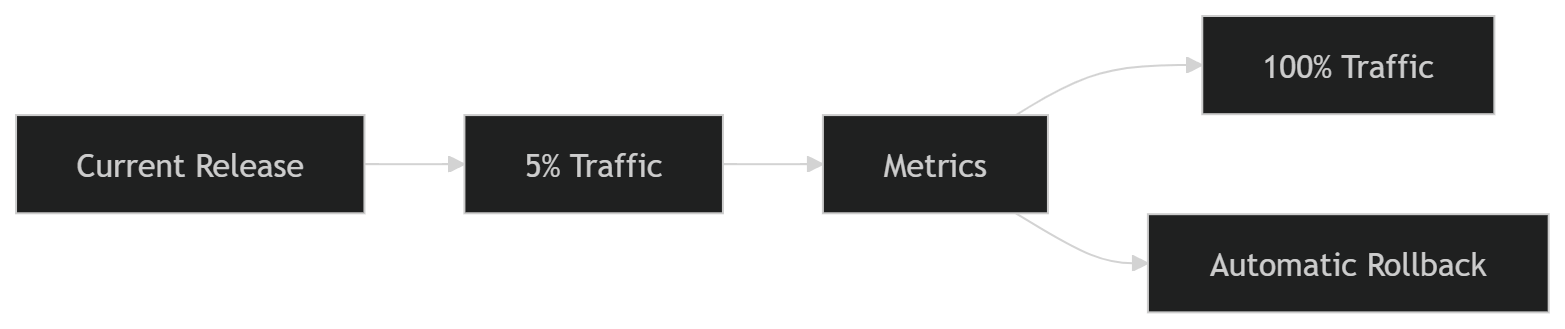
Promotion is based on telemetry, not intuition.
Monitor:
Error rate
Latency
Token cost
Request success rate
User feedback
If any exceed defined thresholds, the release should roll back automatically.
Drift Detection
Infrastructure changes outside Terraform create drift.
Examples include:
Manual firewall changes
IAM policy edits
New storage buckets
Deleted resources
Drift should be detected automatically during CI and corrected through version-controlled changes.
Infrastructure should have one source of truth.
Git.
Platform Engineering Principles
Every production platform should satisfy these principles:
Reproducible from code
Fully automated deployments
Version-controlled infrastructure
Immutable container images
Declarative Kubernetes resources
Observable by default
Least-privilege access
Automated rollback
Continuous validation
These principles reduce operational risk and make the platform predictable as it grows.
Security, Reliability and Operating AI in Production
Running an AI application is relatively easy.
Operating one for months without security incidents, runaway costs, or reliability problems is much harder.
Production engineering begins after the first successful deployment.
Production Security Architecture
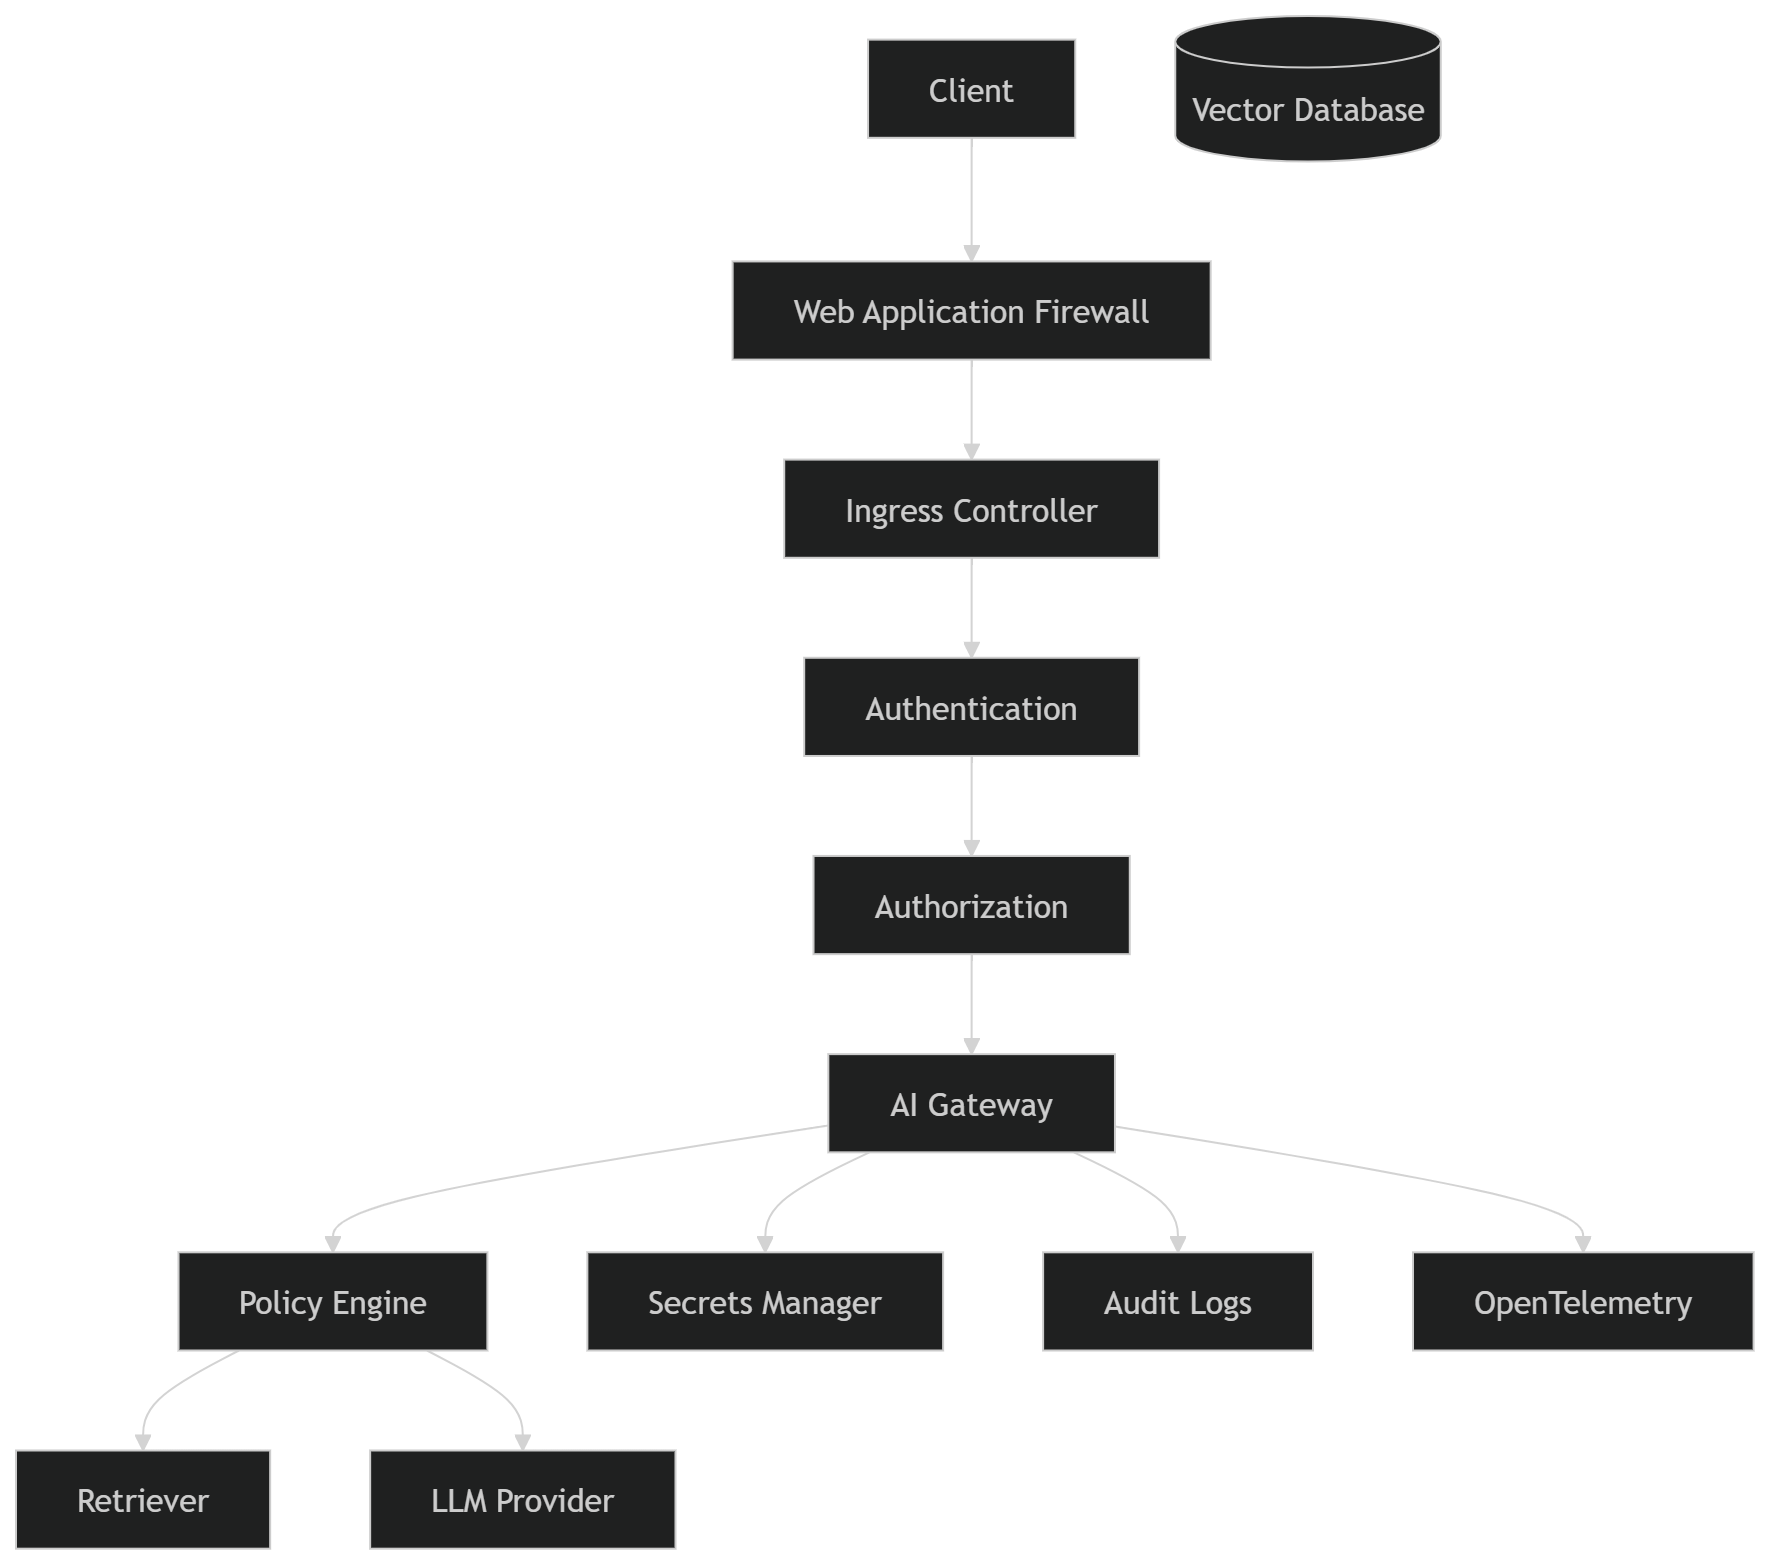
Security should be part of the request path.
Not something added after deployment.
Every Prompt Is Untrusted Input
Most applications validate user input.
Many AI applications don’t.
Every prompt should be treated like external input.
Potential risks include:
Prompt injection
Jailbreak attempts
Sensitive data exposure
Tool misuse
Excessive token consumption
Malicious file uploads
Prompt validation belongs in the platform.
Not inside individual applications.
Production Request Pipeline
User Request

↓

Authentication

↓

Authorization

↓

Rate Limiting

↓

Prompt Validation

↓

Content Filtering

↓

Context Retrieval

↓

Model Selection

↓

Response Validation

↓

Telemetry

↓

Response
Each stage reduces operational risk.
Secrets Should Never Reach Git
One leaked API key can become a five-figure cloud bill.
Production systems should retrieve secrets only at runtime.
Examples include:
OpenAI API keys
Anthropic API keys
Database passwords
Object storage credentials
Encryption keys
Applications should never know where secrets are stored.
They should only know how to request them securely.
Reliability Is More Than Uptime
Infrastructure can report 100% availability while users experience poor responses.
Production AI platforms should monitor:
| Infrastructure | AI Platform |
|---|---|
| CPU | Prompt Success Rate |
| Memory | Hallucination Rate |
| Disk | Token Consumption |
| Network | Cost Per Request |
| Pod Health | Prompt Latency |
| API Errors | User Feedback |
The platform is healthy only when both layers are healthy.
Failure Recovery

Production platforms assume dependencies will fail.
The objective is graceful degradation rather than complete outage.
Cost Is an Operational Metric
Many teams monitor infrastructure costs monthly.
Production AI systems require near real-time visibility.
Track metrics such as:
Cost per request
Cost per customer
Cost per model
Cost by feature
Token consumption
Cache hit ratio
Average prompt length
Without these metrics, optimization becomes guesswork.
AI Policy Layer
Every production platform should answer questions before a request reaches the model.
Examples:
Can this user access this model?
Does this prompt contain sensitive information?
Has the request exceeded its quota?
Is the selected model approved for production?
Does this request violate organizational policy?
Policy enforcement belongs at the platform level.
Not inside application code.
Incident Response
A production incident should follow a repeatable process.
Alert

↓

Incident Created

↓

Telemetry Review

↓

Trace Analysis

↓

Root Cause

↓

Mitigation

↓

Rollback

↓

Verification

↓

Post-Incident Review
The objective is not only restoring service.
It is preventing the same failure from recurring.
Production Readiness Checklist (continued)
Before exposing an AI service to customers, verify that it has:
Multi-factor authentication
Role-based access control
API rate limiting
Prompt validation
Secret management
Distributed tracing
Centralized logging
Cost monitoring
Automatic rollback
Disaster recovery
Audit logging
Backup and restore procedures
Security scanning
Dependency vulnerability scanning
Policy enforcement
Production readiness is measured by operational resilience, not feature count.
Engineering Takeaway
The hardest part of an AI platform is rarely the model.
It is designing the surrounding system so that it remains secure, observable, cost-efficient, and reliable under real production traffic.
Teams that invest in these operational foundations spend less time reacting to incidents and more time improving the product.
From Architecture to Production
Designing the platform is only half the work.
The other half is making sure every deployment is repeatable, observable, and recoverable.
This is where platform engineering becomes operational engineering.
Complete Production Repository
A production repository should separate responsibilities clearly.
production-ai-platform/

├── .github/
│   └── workflows/
│       ├── ci.yml
│       ├── security.yml
│       ├── terraform.yml
│       └── deploy.yml
│
├── terraform/
│   ├── modules/
│   │   ├── networking/
│   │   ├── kubernetes/
│   │   ├── database/
│   │   ├── monitoring/
│   │   └── storage/
│   │
│   └── environments/
│       ├── dev/
│       ├── staging/
│       └── production/
│
├── kubernetes/
│   ├── base/
│   ├── overlays/
│   │   ├── dev/
│   │   ├── staging/
│   │   └── production/
│   │
│   ├── gateway/
│   ├── ai-api/
│   ├── langfuse/
│   ├── prometheus/
│   ├── grafana/
│   ├── loki/
│   ├── tempo/
│   └── ingress/
│
├── argocd/
│
├── helm/
│
├── dashboards/
│
├── docs/
│
├── scripts/
│
└── README.md
Every folder has a single responsibility.
Deployment Pipeline
Every change follows the same deployment path.

Notice something.
No engineer deploys directly to Kubernetes.
Everything flows through Git.
What Happens During CI?
A production pipeline should validate more than code.
Code Push

↓

Linting

↓

Unit Tests

↓

Terraform Validation

↓

Kubernetes Manifest Validation

↓

Container Build

↓

Dependency Scan

↓

Container Vulnerability Scan

↓

Image Signing

↓

Push Image

↓

Update GitOps Repository

↓

ArgoCD Sync
Deployment is the final step.
Validation comes first.
Production Dashboards
A production dashboard should answer operational questions immediately.
Dashboard 1
Platform Health
Monitor:
Request rate
Error rate
Response latency
Availability
CPU
Memory
Network
Dashboard 2
AI Performance
Monitor:
Prompt latency
Completion latency
Token usage
Requests per model
Failed generations
Retry count
Dashboard 3
Business Metrics
Monitor:
Cost per request
Cost per customer
Requests by organization
Daily token consumption
Cache hit ratio
Average prompt size
Infrastructure metrics alone don’t explain production health.
Business metrics matter too.
Incident Example
A customer reports that responses have become slow.
Without observability:
Guess the problem
Restart pods
Hope it improves
With observability:
Customer Report

↓

Locate Trace ID

↓

Identify Slow Request

↓

View Prompt

↓

Check Retrieval Latency

↓

Inspect Model Response Time

↓

Find Root Cause

↓

Deploy Fix

↓

Verify Recovery
The investigation becomes measurable instead of speculative.
Operational Maturity
Production platforms evolve through stages.

Most teams automate deployments.
Fewer automate recovery.
The most mature platforms do both.
Common Mistakes
After reviewing production AI systems, these issues appear repeatedly.
Monitoring infrastructure but not prompts
CPU usage doesn’t explain poor responses.
No prompt versioning
Teams cannot determine which prompt introduced a regression.
Manual production deployments
Every manual deployment increases operational risk.
No rollback strategy
The first failed deployment becomes a production incident.
Missing distributed tracing
Failures cross multiple services, but nobody knows where the delay begins.
Measuring uptime instead of user experience
An API returning HTTP 200 doesn’t guarantee useful output.
Engineering Principles
This platform follows a few simple rules.
Infrastructure should be reproducible.
Deployments should be automated.
Every request should be observable.
Security should be built into the platform.
Rollbacks should be automatic.
Failures should be explainable.
Costs should be measurable.
Recovery should be practiced before incidents occur.
These principles apply regardless of which model provider you use.
Final Thoughts
The discussion around AI often focuses on model quality.
Production teams face a different reality.
They operate systems where latency, reliability, security, observability, and cost determine whether a feature succeeds.
Models will continue to improve.
The challenge is building platforms that can support them predictably.
As a 17-year-old working in cloud and platform engineering, this is the area I find most interesting. Building reliable systems requires more than selecting a model. It requires understanding how every component behaves under production conditions and designing the platform so that failures are expected, observable, and recoverable.
That is the difference between deploying an AI application and operating an AI platform.
Lessons Learned and Where the Industry Is Going
After building this platform, one conclusion became difficult to ignore.
The hardest problem in AI is no longer generating responses.
It’s operating the systems that generate them.
Every month we see better models.
The infrastructure problems remain the same.
Production incidents
Cost overruns
Poor observability
Security risks
Model routing
Vendor lock-in
Compliance
Reliability
The conversation is slowly shifting from “Which model should we use?” to “How do we operate AI systems at scale?”
That is a much harder engineering problem.
The Shift From Software Engineering to Platform Engineering
Traditional applications looked like this.
Frontend

↓

Backend

↓

Database

↓

User
Modern AI platforms look like this.
User

↓

API Gateway

↓

Authentication

↓

Policy Engine

↓

Prompt Router

↓

Retrieval

↓

Vector Database

↓

Model Gateway

↓

LLM

↓

Tool Calling

↓

Observability

↓

Evaluation

↓

Monitoring

↓

User
Notice what changed.
The model became just one component.
The surrounding platform became the product.
The Next Five Years
I think platform engineers will spend less time deploying models and more time answering questions like:
Which model should handle this request?
Should this request use a local model or a hosted API?
Can this response be cached?
Is the additional latency acceptable?
Did this deployment increase cost per request?
Should traffic automatically shift to another provider?
Those aren’t machine learning questions.
They’re infrastructure questions.
Architecture Evolution

The industry is moving away from evaluating models in isolation.
Competitive advantage increasingly comes from operating them efficiently.
Skills That Will Matter More
Technology changes.
Engineering principles don’t.
The skills I believe will continue to matter include:
Linux
Networking
Kubernetes
GitOps
Infrastructure as Code
Distributed Systems
OpenTelemetry
Security
Observability
Cost Engineering
Reliability Engineering
These skills remain valuable regardless of whether the underlying model is GPT, Claude, Gemini, or an open-weight alternative.
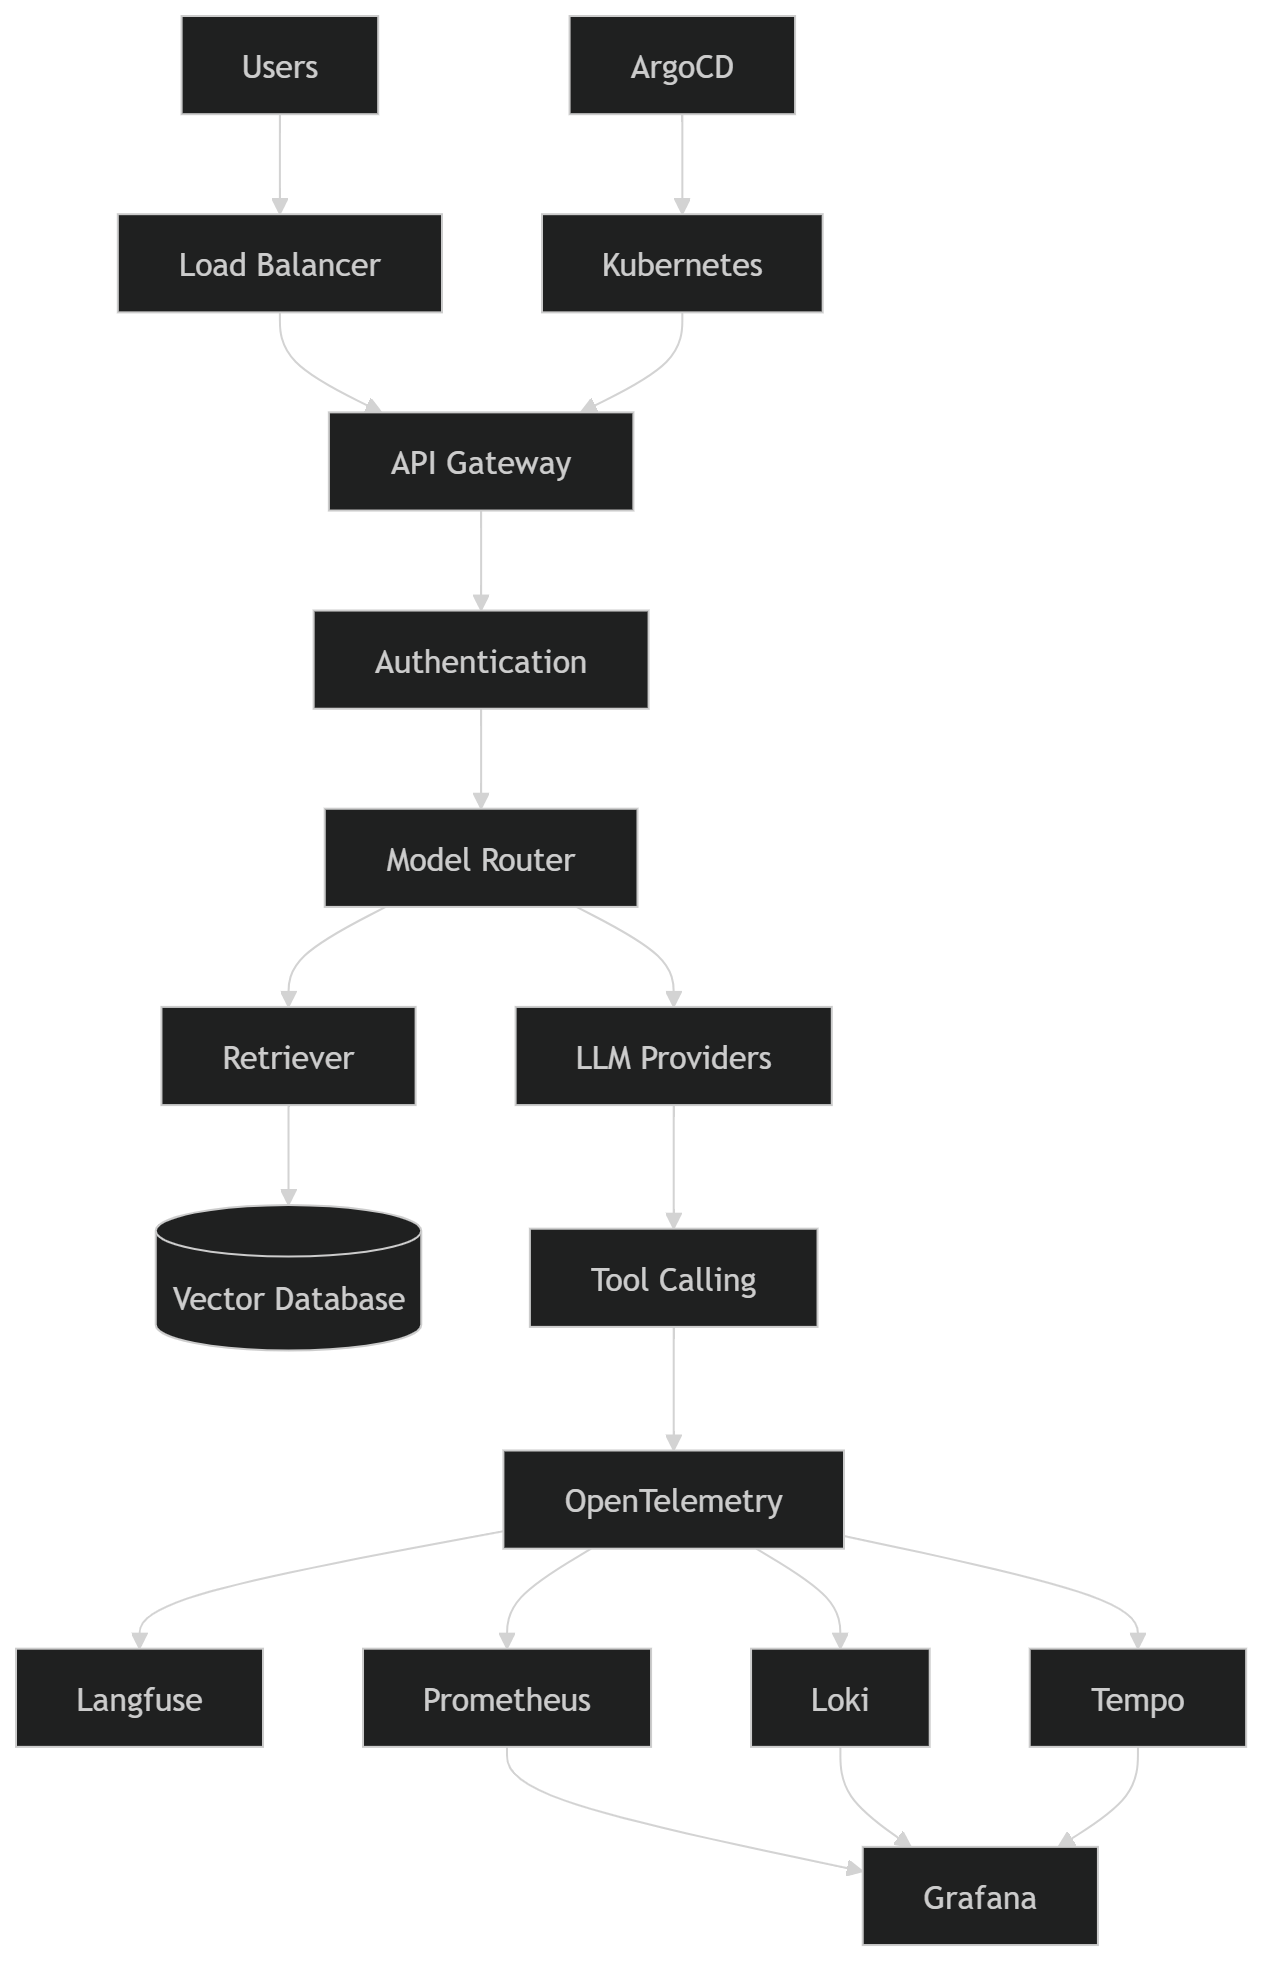
Final Architecture
Closing Thoughts
I’m 17 years old, and I don’t claim to have seen every production environment or solved every infrastructure problem.
What I do know is this:
Reliable systems are built through engineering discipline, not optimism.
The more I learn about cloud, DevOps, and platform engineering, the more convinced I become that the future of AI won’t be defined only by better models.
It will also be defined by the engineers who make those models secure, observable, cost-efficient, and reliable enough to run in production every day.
That’s the area I intend to keep exploring.
References
OpenTelemetry documentation
Kubernetes documentation
Prometheus documentation
Grafana documentation
Langfuse documentation
CNCF landscape
Argo CD documentation
Terraform documentation